Digital Panel Indicators
Digital Panel Meters perform digital processing on or conversion and display of voltages, currents, other analog signals, and pulse signals. They can also compare input values to set values, transfer data, and perform other functions.
| Introduction |
|
| Principles | Classifications |
| Engineering Data |
|
|
|
Troubleshooting |
-
 What Is a Digital Panel Indicator?
-
 Analog Signals
-
 Measurement Methods
-
 Main Functions
-
 Settings and Displays
-
 Configuration Examples
What Is a Digital Panel Indicator?
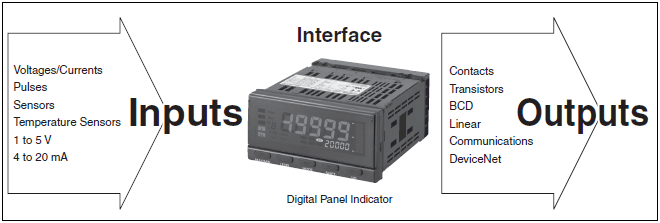
A Digital Panel Indicator digitally processes measurement data, such as an analog signal from a linear sensor (including a voltage and current), or a pulse signal. It then converts and displays the data.
They can also act as interfaces (see note) by performing operations such as comparisons with user-set values, and transmitting data to computers and PLCs.
OMRON Digital Panel Indicators have good visibility in the field, are easy to use, are waterproof, and conform to international standards. Communications with host computers or programmable controllers have been improved to provide functionality for advanced information systems, such as data collection to increase operating rates and data recording capabilities to provide for implementing measures for PL laws and ISO.
Note: An interface is the boundary between two devices.
Analog Signals
Note:An analog signal is a signal that changes continuously.
Types:
4 to 20 mA DC
1 to 5 VDC
0 to 5 VDC
0 to 10 VDC
etc.
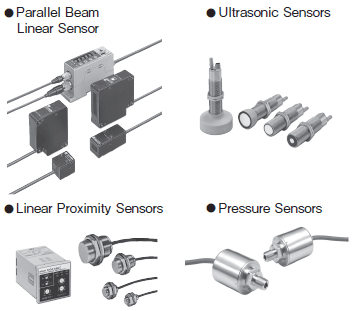
A Wide Range of Voltages/Currents

Infrared Thermosensors

Proximity Sensor or Rotary Encoder

Displacement, Length Measurement, or Linear Output Sensors
Measurement Methods
An input signal that is within the measurement range of the Digital Panel Indicator can be directly connected to the input terminals.
The following methods can be used to measure signals that exceed the measurement ranges.
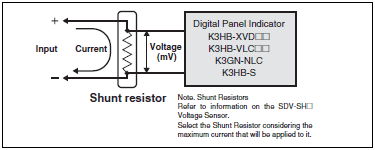
Measuring High DC Currents
A shunt resistor can be used in the input section to convert a DC current to a DC voltage to measure a high DC voltage.
Measuring High AC Currents
Install an external current transformer (CT) to reduce the current flow for measurement.

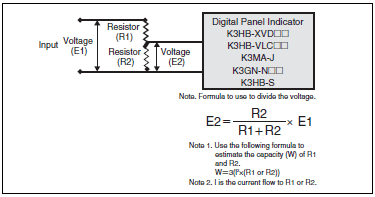
Measuring DC voltages
Install an external voltage dividing circuit to divide the voltage for measurement.
Measuring High AC Voltages
Install an external power transformer (PT) to reduce the voltage for measurement.

Main Functions
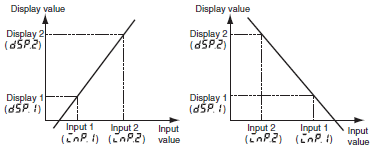
Scaling
Scaling is a function that converts the signal output from various sensors into physical measurement units (pressure, level, flow, etc.) before displaying it.
There are two scaling methods, one of which sets two points:
any input value and its corresponding converted value. The other method is teaching by actual inputs.
Position Meter
The present measurement value is displayed as a position in relation to the scaling width on a 20-gradation position meter.
Average Processing
Average processing of input signals with extreme variations eliminates flicker in the display and reduces the effect of noise in the input signal.
There are two types of averages that can be used, the simple average and the moving average.
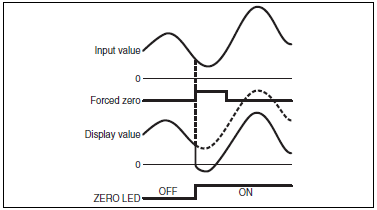
Forced Zero
It is possible to shift the present value to zero by selecting zero from the front-panel keys. It is useful for setting reference values for measurement.
Timing Chart of a Forced Zero
Timing Hold
Prompted by an external timing signal, it can simultaneously measure the maximum value, minimum value, and the difference between maximum and minimum values.
Maximum/Minimum Hold
Holds the maximum and minimum measurement values.
Display Color Selection
The color of the PV display can be set to either green or red.
It is also possible to set the current value to change color according to the status of the comparative output.
Bank Selection
It is possible to switch between eight comparative value banks using the keys on the front-panel or external inputs.
Settings and Displays
Example Using the K3HB-X
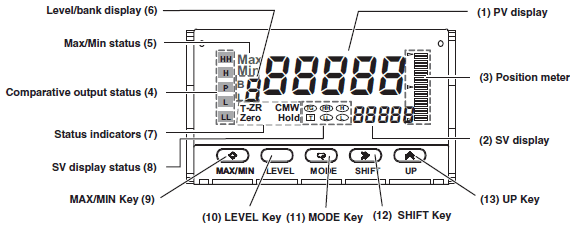
| No. | Name | Function |
| (1) | PV display | Displays PVs, maximum values, minimum values, parameter names, and error names. |
| (2) | SV display | Displays SVs and monitor values. |
| (3) | Position meter | Displays the position of the PV with respect to a desired scale. |
| (4) | Comparative output status indicators | Display the status of comparative outputs. |
| (5) | Max/Min status indicator | Turns ON when the maximum value or minimum value is displayed in the RUN level. |
| (6) | Level/bank display | In RUN level, displays the bank if the bank function is ON. (Turns OFF if the bank function is OFF.) In other levels, displays the current level. |
| (7) | Status indicators | T-ZR: Turns ON when the tare zero function is executed. Turns OFF if it is not executed or is cleared. Zero: Turns ON when the forced-zero function is executed. Turns OFF if it is not executed or is cleared. Hold: Turns ON/OFF when hold input turns ON/OFF. |
| (8) | SV display status indicators | TG: Turns ON when the timing signal turns ON. Otherwise OFF. T: Turns ON when parameters for which teaching can be performed are displayed. HH, H, L, LL: In RUN level, turn ON when the comparative set values HH, H, L, and LL are displayed. |
| (9) | MAX/MIN Key | Used to switch the display between the PV, maximum value, and minimum value and to reset the maximum and minimum values. |
| (10) | LEVEL Key | Used to switch level. |
| (11) | MODE Key | Used to switch the parameters displayed. |
| (12) | SHIFT Key | Used to change parameter settings. When changing a set value, this key is used to move along the digits. |
| (13) | UP Key | When changing a set value, this key is used to change the actual value. When a measurement value is displayed, this key is used to execute or clear the forced-zero function or to execute teaching. |
Configuration Examples
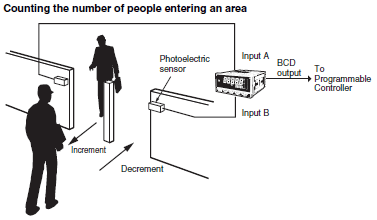
Up/Down Counting Pulse Indicator
K3HB-C Application Example
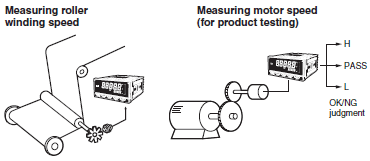
Rotary Pulse Indicator
K3HB-R Application Examples
Timer Interval Indicator
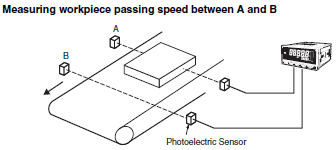
K3HB-P Application Example
