Electoric Power Monitoring Equipment
Power monitoring equipment from portable Power Sensors for simple measurement to high-precision Power Sensors for constand monitoring. Our line-up also includes Power Sensors with earth leakage and momentary voltage drop monitoring.
|
|
Features |
| Principles | Classifications |
| Engineering Data | Further Information |
|
|
Troubleshooting |
How to Promote Energy-Saving Activities
Why Is Visualization Important?
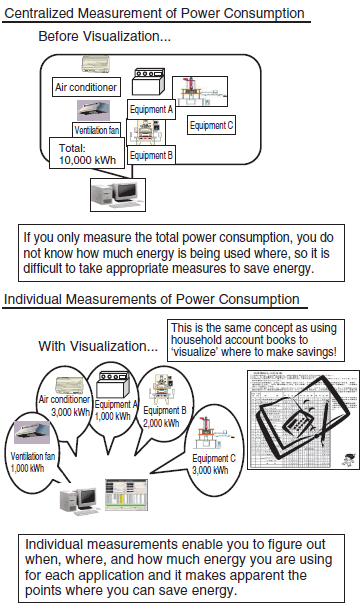
The Basics of Improved Energy Saving through Visualization
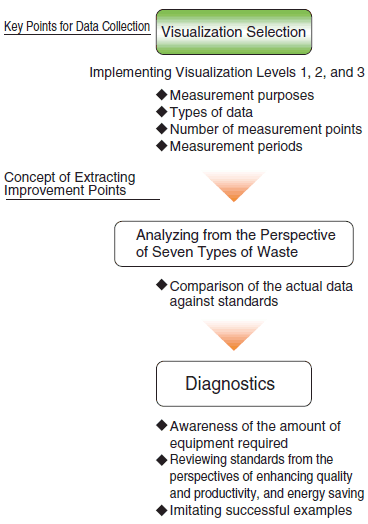
Visualization Levels 1, 2, and 3
Visualization can be divided into three visualization levels according to the power consumption that is visualized and the type of power consumption data that is collected. With the facility shown below, you see what type of power consumption is measured and visualized.
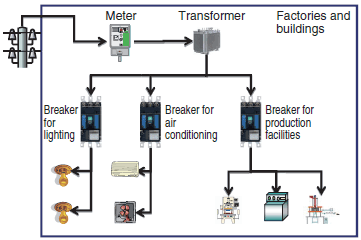
(1) Visualization Level 1: Demand Measurement (Total Consumption)
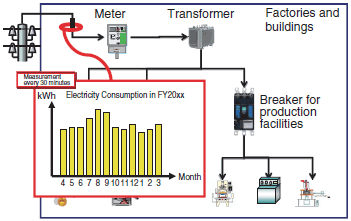
(2) Visualization Level 2: Secondary Side Measurement (Consumption Breakdown)
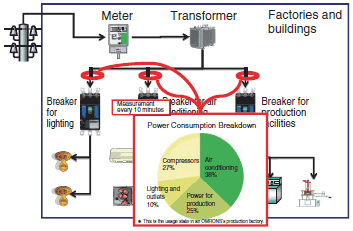
(3) Visualization Level 3: Individual Measurement (Energy Balance)
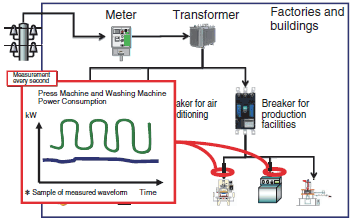
The Seven Types of Waste
Extract margin for improvement from the perspective of seven types of waste.

Example 1
Visualization Improvement Example of Level 2: Margins and Combinations
There is a tendency for factory equipment to be laid out and designed with extra capacity. The key point for eliminating waste is to discover where it is possible for the perspectives of margins and combinations to complement each other and to help stop waste.
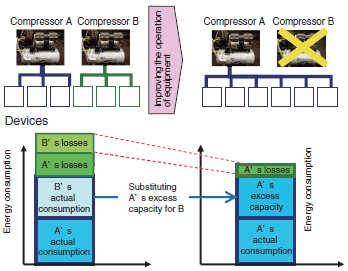
Example 2
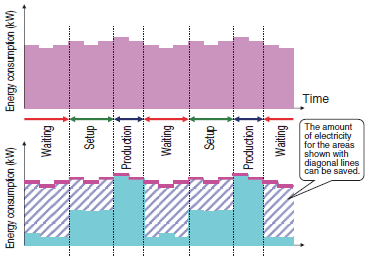
Visualization Improvement Example of Level 3: Waiting
Look at certain production equipment, link energy usage and production timing and stop or reduce consumption during times that are not creating added value (i.e., unrelated to production).
